Greenscreens.ai is a dynamic pricing infrastructure for the truckload spot rate market that delivers buy and sell-side market intelligence and business insights to help you grow and protect your margins.

Table of Content
Integration Set Up
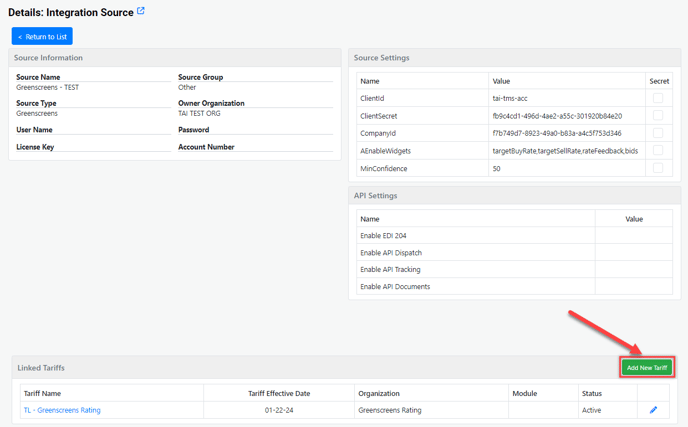
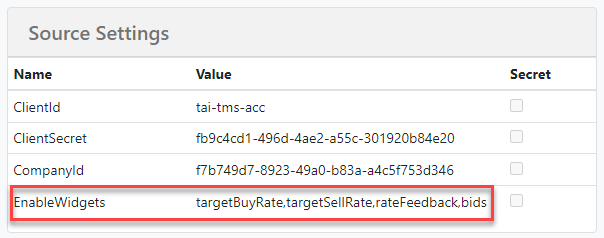
Greenscreens will provide three components that are required to be set as Source Settings.
Source Settings:
ClientId: Value
ClientSecret: Value
CompanyId: Value
After the source settings are set up, link the LSP Organization that should have access to the Greenscreen data.
Note: If a custom URL is being used, that will need to be provided to the Greenscreens team to whitelist in order for the widgets to show up correctly.
Workflow
Once enabled, the greenscreens.ai widget will be displayed in the Market Intelligence section of the Truckload Quoting screen. When expanded, details about the specific lane are made available.
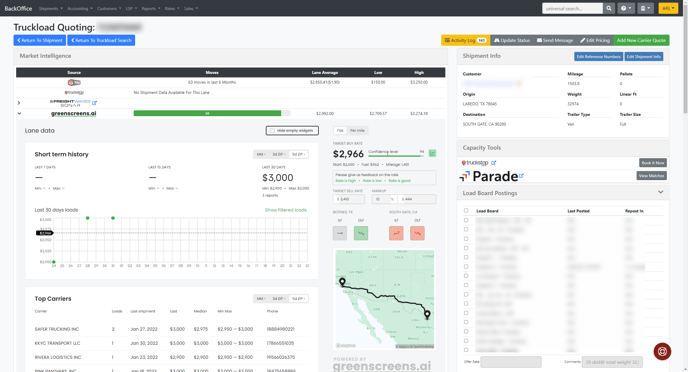
Greenscreens will provide predicted rate and market activity information such as:
- Confidence level
- Target buy rate / Target sell rate
- Negotiations start rate
Widgets
- Network Rate: Shows the rate prediction for the aggregated data that resides in the Greenscreens.ai network unbiased by your own buying power.
- Carrier Bids: Connects you to your carrier network by requesting and receiving real-time bids for the lane. Allows you to see all bids your company has requested and received for the lane as another indicator of market behavior.
- Quote customers: Be more responsive to your customers' requests for quote. Initiate a detailed quote email to your customer directly from your Greenscreens Web UI. Provides the flexibility to adjust mileage, markup and add accessorial charges.
- Short term history details: Shows the most short-term historical data for the last 7, 15, and 30 days. The large text in this section represents the AVERAGE rate for the lane in this time period. Users can use the "Mkt", "3d zip" and "5d zip" buttons to expand or contract the geographical region represented in the data. Note that a green dot beside the button indicates that there is data available at that geographical level. In the lower part of the widget, the System shows a graph with dots that represent actual loads - the bigger and bolder the dot, the more activity there has been. By hovering over the dot you will see a summary of load activity including date, average rate, and the number of loads. You can click on each dot and view the details of the load activity.
- Long Term History: Shows graphically shows the min, max, and average rate and number of reports for the last 12 months for both market rates and your own historical data. You may also expand and contract the geographical area using the buttons in the upper right corner of the widget.
- Inbound/Outbound load flow for both pickup and dropoff
- Route map
- Top Carriers: This widget shows a list of your Carriers who have previously moved a load for the selected lane in the last 3 months. The list of carriers here represents carriers that are in YOUR network who may be eligible to move a new load for you. This widget includes the Carrier Name, # of loads they have moved, the last shipment date, the last rate, the average rate, and the carrier’s minimum and maximum rate on the lane. You can select the geography level for which you want to view the top Carriers, request a bid from a particular or all Carriers from the list.
- Negotiations Coach: Shows useful advice that can be used for negotiating a price with a carrier as well as other insights that may impact your ability to negotiate and price levels for the lane.
- Lane Analytics: Shows several KPIs for the selected lane based on your historical data - cover time, lead time, transit window, and the average margin.
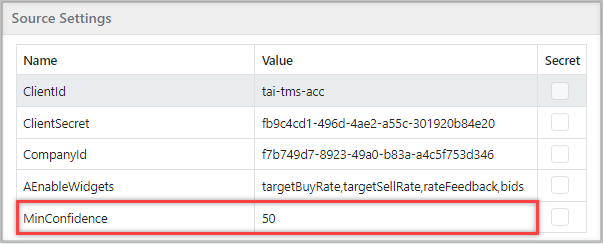
How to Set Specifics Widgets
You can add a source setting in the integration called "EnableWidgets" and add the name of the widget you wish to be available in truckload quoting.
The system will display all widgets if the integration source does not exist.
Example: EnableWidgets = targetBuyRate,targetSellRate,rateFeedback,bids
Widget name formats for integration source
targetBuyRate
targetSellRate
rateFeedback
marketIndices
routeMap
shortTermHistory
longTermHistory
topCarriers
negotiationCoach
laneAnalytics
dat
networkRates
bids
quotes
Tariff Rating